Norm Reports
Norm Tables, Ratio Tables, Quartiles
Norms are the final comparative results from each study year, presented at the 2-digit and 4-digit CIP level. Institutions have access to the norms from each year they participate in The Cost Study. Data in the norms is considered a frozen file at the time the norms are released, typically in July each year (though preliminary norms are released in May).
Norm Groups: Comparative values are available for three norm groups: Carnegie Class Set, Highest Degree, and Percent Undergrad. Note that the Carnegie Class Set grouping category is the same across an entire institution, whereas Highest Degree and Percent Undergrad fluctuate based on the individual programs reported. Programs are placed into the appropriate category based on the degree data provided in the First Majors Only section. Options available under each norm group are as follows:
Carnegie Class Set
- Research Institution (Doctoral Universities: Very High Research Activity and Doctoral Universities: High Research Activity)
- Doctoral Institution (Doctoral/Professional Universities)
- Comprehensive Institution (Master’s Colleges & Universities: Larger, Medium, and Smaller Programs)
- Baccalaureate Institution (Baccalaureate Colleges: Arts & Sciences Focus and Baccalaureate Colleges: Diverse Fields)
Highest Degree
- Doctorate/Professional
- Masters
- Bachelors
- No Degree:
Note – the No Degree category includes programs where the checkbox was selected, or any program that reports zero degrees for all four degree categories under the First Majors Only section. The No Degree category may also include programs that offer Associate’s degrees or Certificate programs, but not Bachelors, Masters, or Doctorate/Professional degrees.
Percent Undergrad
- 75-100%
- 50-74%
- 25-49%
- 0-24%
Note – non-degree programs will not be included in any of the Percent Undergrad norm group categories.
Important Notes about Norm Calculations:
- Programs within an institution that roll-up to the same 4-digit CIP are aggregated prior to norm calculation by adding values in each raw data cell together. This aggregation also occurs if two programs are reported using the same 4-digit CIP.
- Norms are only produced when there are at least five programs for that CIP based on the norm group category selected.
- The overall sample size for a CIP (as shown on the norm tables) is based on the largest sample size in a column on the ratio table. In other words, some of the norms values may be calculated from rows that have blank values in some columns. If there are not at least five values for a given metric (not including blanks), then a norm value for that metric will not be provided. The ratio tables show the row level data and the actual sample size for each metric. For Table 4, a program will only be included in the ratio table, and therefore the norm calculation, if it has a value for die/sch. Because some programs do not report any cost data, the sample size for Table 4 may be different than the other tables.
- Norms are refined means: any value greater or less than two times the standard deviation is not included in the refined mean.
View the Norm Tables:
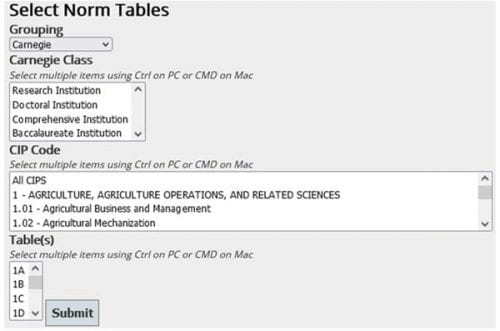
In the portal, click on the Norms tab and “Show Norms”. Here you can select the norm group(s), CIP codes, and tables of interest. Resulting tables will then show you the refined means for all the CIPS/tables that you selected. These tables can then be copied to the clipboard one-at-a-time, and pasted into another program for further analysis.

View Ratio Tables for the Norms:
On the Norms tab in the portal, select “Show Ratio Tables for Norms” to select the norm group and norm group category(s), a single CIP code, and tables of interest. Resulting table(s) show row level data for each institution that reported that CIP and belongs to the selected norm group category. In addition, the tables show the sample size, mean, standard deviation, outliers, and the refined mean for each metric. Note that the row level data is listed without any identifying information for confidentiality purposes.
View Quartiles for the Norms:
Quartiles are provided for all three norm groups for the following metrics on Table 3 and Table 4.
Table 3
- Total SCH/FTE Faculty (All Instructional Faculty Combined)
- Total OCS/FTE
- FTE Student/FTE Faculty
Table 4
- Direct Instructional Expense / SCH
- Direct Instructional Expense / FTE Student
- Personnel Cost as a % of Direct Instructional Expense
The quartile calculations can be replicated in Excel using the row level data provided in the norm ratio tables. Data identified as an outlier (two standard deviations above or below the mean) are also excluded from quartile calculations. The excel function =quartile.exc(array,quart) can be used to obtain the same value when array=all of the values excluding outliers and quart equals 1, 2, or 3 depending on the quartile you wish to obtain.
