Three-Year-Average Benchmarks
The institution report with three-year-average benchmarks for Table 3 and Table 4 is beneficial to institutions because it provides comparative data earlier in the study cycle (typically around February / March) once an institution’s data has been validated and approved by The Cost Study team. These benchmark values are calculated averages from all the programs reported at the same CIP4 level over the previous three study years. Another benefit to this report is that the Three-Year-Average metrics are shown side-by-side with your institution’s data. Comparative values are available for three benchmark groups: Carnegie Class, Highest Degree, and Percent Undergrad and control type: Public, Private, or All. Note that here, the Carnegie Class option is specific to a single Carnegie Class compared to the norm benchmark option which uses a set of Carnegie Classes grouped together.
View the Three-Year-Average Benchmarks
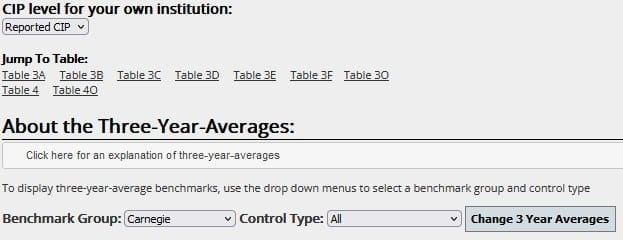
In the portal, click on the Reports tab and “View Institution Report with 3-year-average benchmarks.” Select the benchmark group (Carnegie Class, Highest Degree, or Percent Undergrad), and control type (All, Public, Private) and results will be displayed in the yellow columns, side-by-side with your institution’s data. The report defaults to display averages based on ‘Carnegie’ and ‘All’ unless you make changes to the drop-down menus (see screenshot below). Additionally, the report defaults to display metrics for each program your institution submitted. A drop-down menu at the top of the screen provides options for rolling up your institution’s data, and for viewing the three-year-average benchmarks at the 4-digit or 2-digit CIP level:
- Selecting Reported CIP will display your institution’s data as disaggregated as possible, with the name you provided in the Program Name column. The 3-year-average data is displayed at the 4-digit CIP level. If your institution’s program was reported at the 2-digit CIP level, then the three-year-average will be blank.
- Selecting 4-digit roll up displays your institution’s data and the 3-year-averages at the 4-digit level. Program names will use the standard NCES CIP Code Names at the 4-digit level.
- Selecting 2-digit roll up displays your institution’s data and the 3-year-averages at the 2-digit level. Program names will use the standard NCES CIP Code Names at the 2-digit level.

Three-year-average values can also be viewed on Page 2 of the data entry forms both during and after data validation. Similar drop-down menus are available to view the three-year-average benchmarks based on the three benchmark groups and control type, as well as 4-digit and 2-digit CIP levels.
Three-year-average benchmark values are available for the following calculated metrics:
Table 3A through 3F
- Undergrad SCH/FTE Faculty (faculty type is based on the table letter A-F)
- Grad SCH / FTE Faculty
- Total (undergrad + grad) SCH / FTE Faculty
- Total OCS / FTE Faculty
Table 3O
- % online undergrad SCH for the fall
- % online grad SCH for the fall
- % online total (undergrad + grad) SCH for the fall
Table 4
- Direct Instructional Expense / SCH
- Direct Instructional Expense / FTE Student
- Personnel Cost as a % of Direct Instructional Expense
- Research Expense per FTE T/TT Faculty
- Public Service Expense per FTE T/TT Faculty
- Research + Public Service Expense per FTE T/TT Faculty
Table 4O
- % online undergrad SCH based on annual SCH
- % online grad SCH based on annual SCH
- % online total (undergrad + grad) SCH based on annual SCH
Important Notes about Three-Year-Average Calculations:
- Programs are first aggregated to the CIP4 level by institution, and then averaged together across the three years. For instance, if one school has 4 programs reporting to CIP 5.01, raw data from all four will be added together and the metrics will be calculated as one aggregated value. This aggregated value is then used in the mean and refined mean calculations for the three-year-average benchmark.
- Because these values don’t include comparative data from the current study year, the report is available as soon as your institution’s data is approved in the portal.
- When calculating a 3-year-average benchmark for Direct Instructional Expense per Student Credit Hour (DIE/SCH) and Direct Instructional Expense per FTE student (DIE/FTE), there is one caveat that eliminates outlier programs before the standard refined means are calculated. Any program (or program aggregated at the institution level) that has a DIE/SCH value that is not >= 1 or <=4500 is excluded. The rationale for this decision is because of a methodological issue with the refined means approach. Occasionally a single institution has extremely high costs for a certain program. If this institution appears in the dataset 3 times (once across each of the three years), the refined means approach does not necessarily remove the institution as an outlier in all three instances. For all remaining programs in a given CIP at the four-digit level, a mean and standard deviation is calculated. Any value greater or less than 2 standard deviations from the mean are excluded as outliers, and the refined mean is calculated from the rest of the data.
Benchmark Group Options for 3-year-average values:
Carnegie Class:
- Doctoral Universities: Very High Research Activity (R1)
- Doctoral Universities: High Research Activity (R2)
- Doctoral/Professional Universities (R3)
- Master’s Colleges & Universities: Larger Programs (M1)
- Master’s Colleges & Universities: Medium Programs (M2)
- Master’s Colleges & Universities: Smaller Programs (M3)
- Baccalaureate Colleges: Arts & Sciences Focus (B1)
- Baccalaureate Colleges: Diverse Fields (B2)
Highest Degree
- Doctorate/Professional
- Masters
- Bachelors
- No Degree:
Note – the No Degree category includes programs where the checkbox was selected, or any program that reports zero degrees for all four degree categories under the First Majors Only section.
Percent Undergrad
- 75-100%
- 50-74%
- 25-49%
- 0-24%
Note – non-degree programs will not be included in any of the Percent Undergrad benchmark group categories.
