Table 3: SCH, OCS, and FTE Students per FTE Faculty
Table 3 summarizes the fall term faculty workload using the average student credit hours, average organized class sections, and average FTE students taught per FTE instructional faculty as indicators. Note that in all the metrics on Table 3 where FTE faculty is the denominator, the metric uses instructional faculty FTE – meaning the total faculty reported minus the separately budgeted faculty. Also, an FTE student is equivalent to 15 undergraduate student credit hours or 9 graduate student credit hours. These norms are given in the following tables by faculty type as well as for all the faculty combined:
Table 3A: Tenured/Tenure-Track Faculty
Table 3B: Other Regular Faculty
Table 3C: Supplemental faculty
Table 3D: Teaching assistants who taught credit bearing courses
Table 3E: Teaching assistants who taught non-credit bearing courses
Table 3F: All Faculty Combined
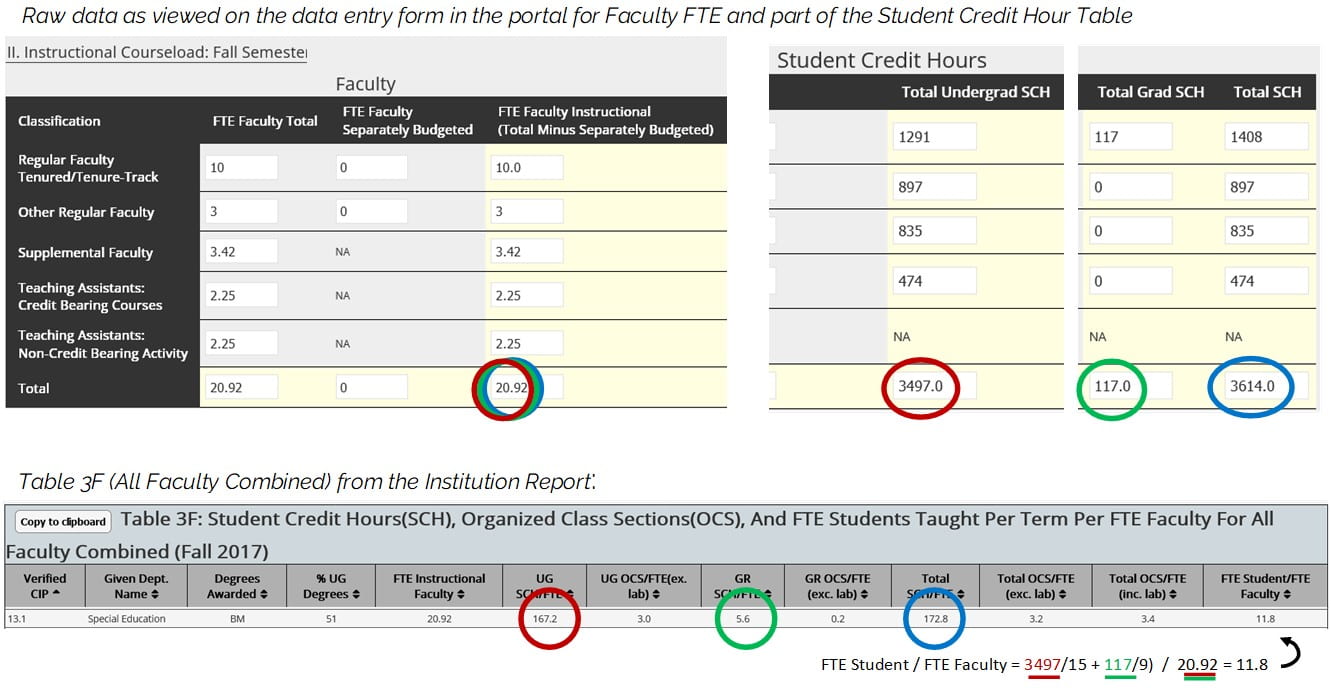
The relationships between the raw data tables and the calculated metrics on Table 3 are shown below.

FTE Student is calculated as total number of undergraduate SCH / 15 + total number of graduate credit hours / 9. The denominators do not change for quarter vs. semester schools because data from Table 3 represents one academic session regardless of calendar type.
Metrics for Table 3 are also calculated for organized class sections / FTE at the undergrad and graduate levels and total organized class sections, both with and without lab sections. Raw data for organized class sections is not pictured, but the calculated metrics are shown in the above Table 3F from the Institution Report.
