

Table 4: Instructional Cost Ratios
Table 4 summarizes direct instructional costs per student credit hour and per FTE student taught using the total student credit hours generated during the academic year and the fiscal year expenditure data. Additional metrics include personnel cost as percent of the total direct instructional expense, and research and public service expenses per FTE Tenure/Tenure Track faculty. Note that these research and public service metrics use the total T/TT faculty, not just the instructional T/TT faculty.
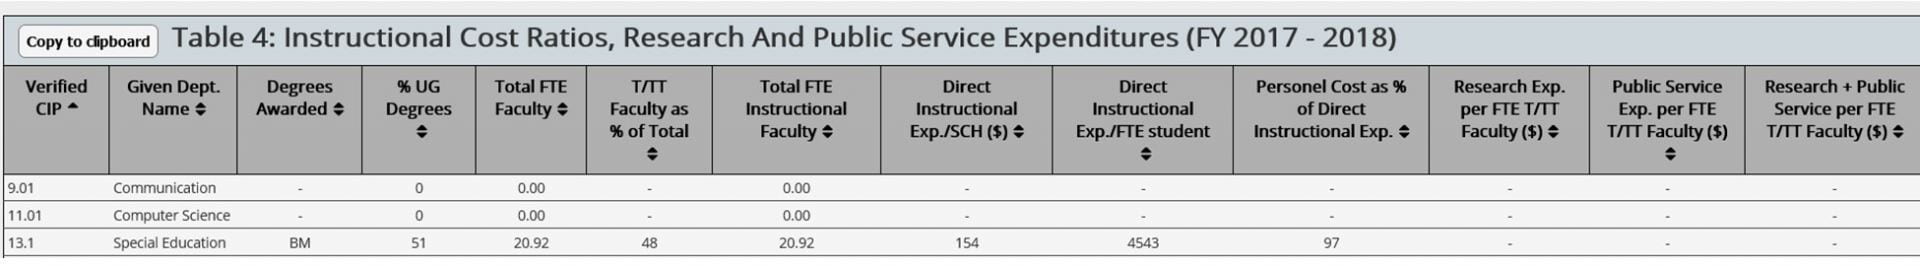
Below is a sample of Table 4 from the Institution Report:
Direct Instructional Expense: Includes the salary, benefits, and other than personnel expenses for a given program.
FTE Student for Table 4: For semester calendar institutions, FTE Student is calculated as the annual undergrad SCH / 30 + annual grad SCH / 18.
For quarter calendar institutions, the calculation is annual undergrad SCH / 45 + annual grad SCH / 27.
Adjustment for Quarter vs. Semester Calendars: As of the 2008 Delaware Cost Study, quarter calendar institutions’ cost/SCH ratio contains an adjustment (dividing their annual SCH by 1.5 so as to make their annual SCH comparable to semester calendar institutions.) This new adjustment complements the adjustment to FTE students that has always taken place: an FTE student taught for semester academic calendar institutions is equivalent to 30 undergraduate student credit hours or 18 graduate student credit hours; and for quarter academic calendar institutions is 45 undergraduate or 27 graduate student credit hours.
Adjustment for Canadian Dollars: Occasionally international schools participate in The Cost Study. Starting in 2015, a conversion rate was added for the Canadian institutions’ financial metrics. When Canadian Schools look at page 2 of their data entry forms, ratios are displayed in Canadian dollars. However, on the institution report, and for all other comparative data reports (norms, three-year-average report, and peer analysis) the financial metrics have been converted to US dollars. Quarterly conversion rates were downloaded from the US Government Treasury Department website. An annual rate was determined by taking an average of four quarterly data points corresponding to the fiscal year used in the study. For example, Study Year data was from the time period July 1, 2014 to June 30, 2015 so we used Sept. 2014, Dec. 2014, March 2015 and June 2015 data. An average of these four points in time was used as the conversion rate for that study year.