Year-over-Year Cost and Productivity Charts
This report allows you to see a bar-chart of your institution’s data for various metrics, along with a table showing the calculated value for each CIP. If your institution has participated in The Cost Study for multiple years, you can view these years of data side-by-side on the same chart and table. The chart provides a quick visual overview of longitudinal fluctuations in these metrics at your institution and can be helpful during the data validation process. The following metrics are included on the charts:
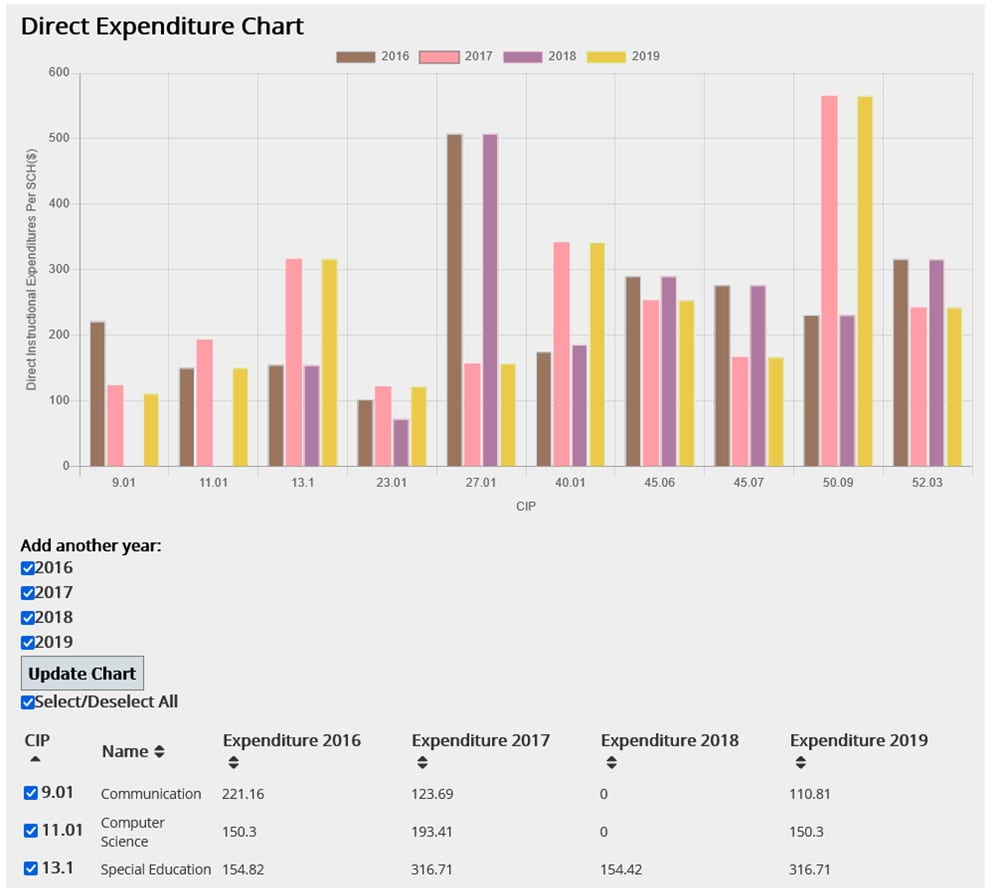
• Direct Instructional Expenditures per SCH
• Direct Instructional Expenditures per FTE Student
• Student Credit Hours per FTE Faculty
• Organized Class Sections per FTE Faculty (excluding and including labs)
• FTE Student per FTE Faculty
• Research Expenditures per FTE T/TT Faculty
• Public Service Expenditures per FTE T/TT Faculty
To view the charts, click on the Reports tab in the portal. A sample chart is shown below: