Table 1: Percent Student Credit Hours (SCH) and Organized Class Sections (OCS) by Faculty Category within Course Level
Table 1 presents the proportional distribution of student credit hours and organized class sections according to the type of faculty teaching them. The distributions are given independently by course level: undergraduate lower division, undergraduate upper division, total undergraduate and total graduate. Norms by faculty type are presented in the following tables:
Table 1A: Tenured/Tenure-Track Faculty
Table 1B: Other Regular Faculty
Table 1C: Supplemental faculty
Table 1D: Teaching assistants who taught credit bearing courses
Table 1E: Teaching assistants who taught non-credit bearing courses
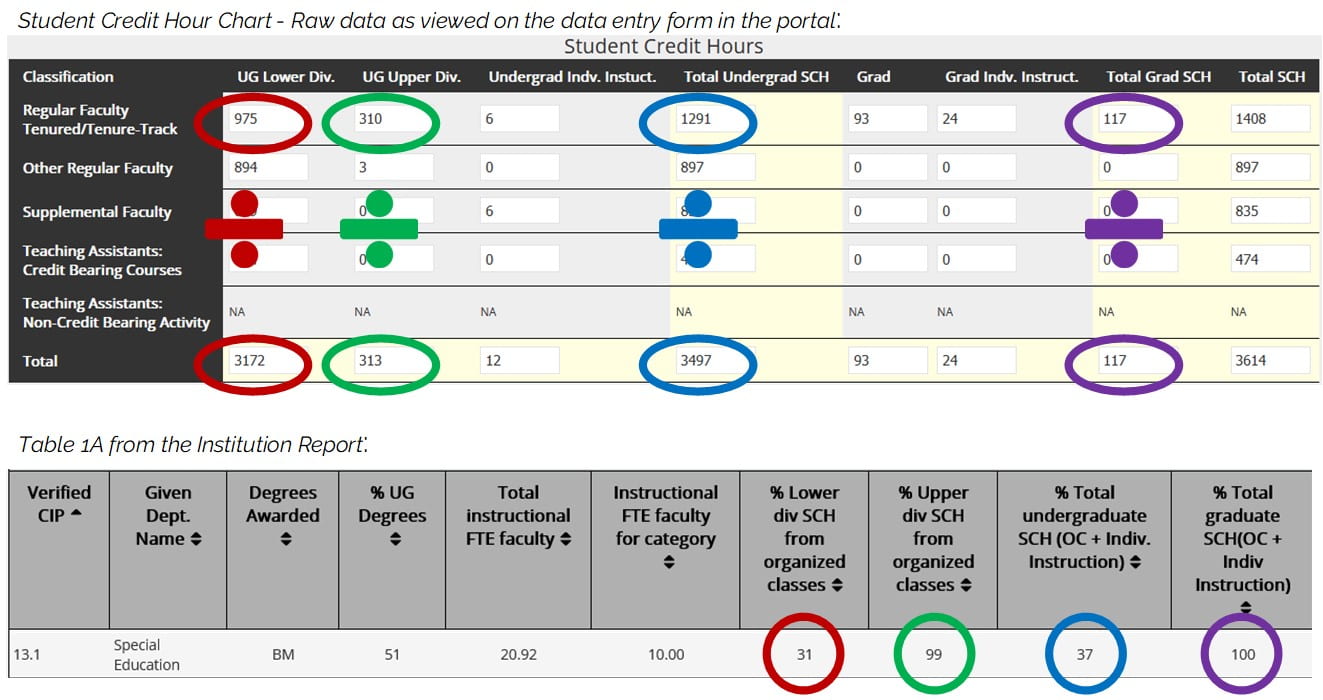
The measures shown on Table 1 are the result of column calculations on the raw data table, as shown in the example below:

The data here in Table 1A tells you that Tenured/Tenure-Track faculty teach 31% of the lower division undergrad SCH and 99% of the upper division undergrad SCH. When combined, they are teaching 37% of the undergrad SCH overall. They are also teaching 100% of the graduate student credit hours.
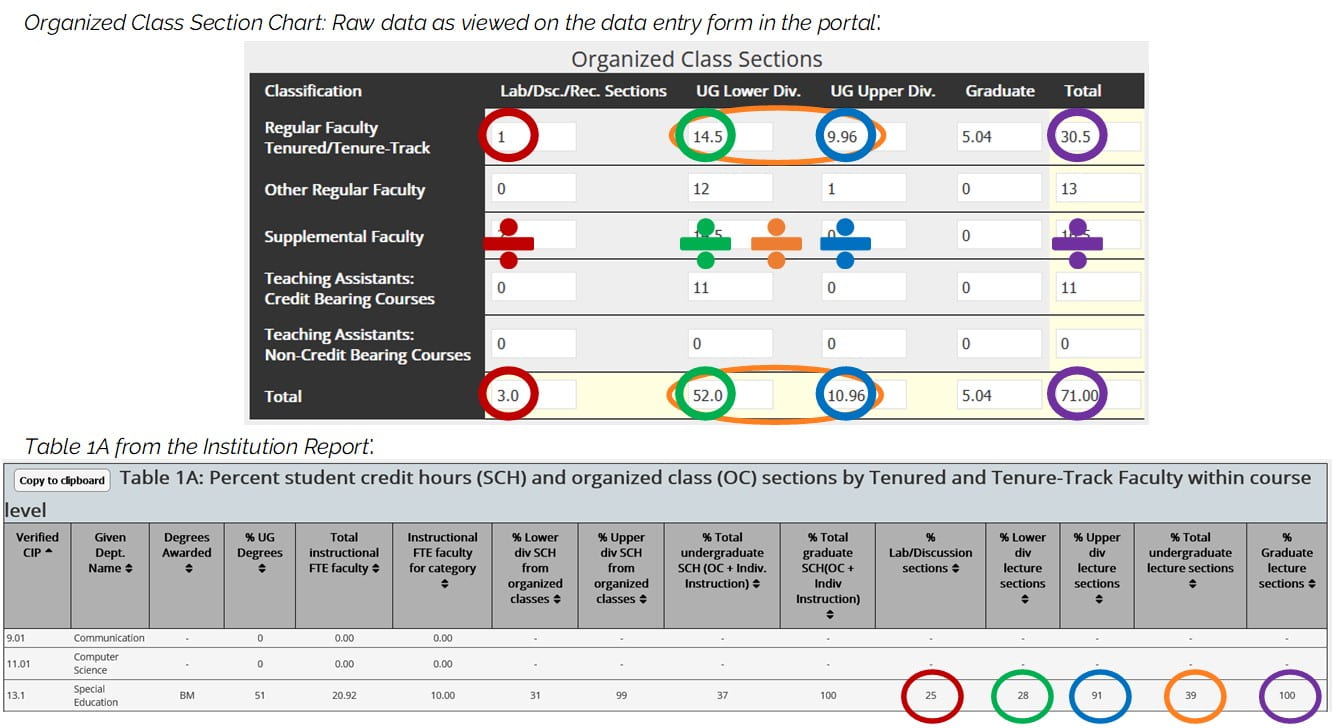
The same column calculations also occur with the Organized Class Sections raw data chart:

