Table 2: Percent Student Credit Hours (SCH) and Organized Class Sections (OCS) by Course Level within Faculty Category
Table 2 presents the proportional distribution of student credit hours and organized class sections taught according to course level for the following faculty types:
Table 2A: Tenured/Tenure-Track Faculty
Table 2B: Other Regular Faculty
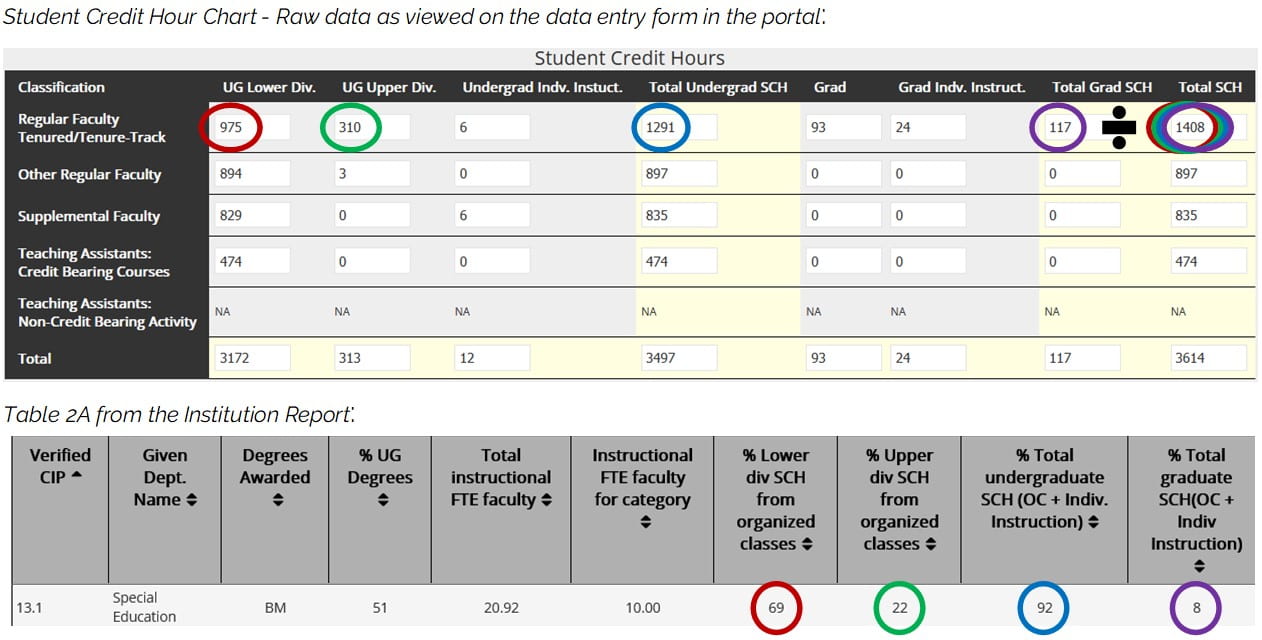
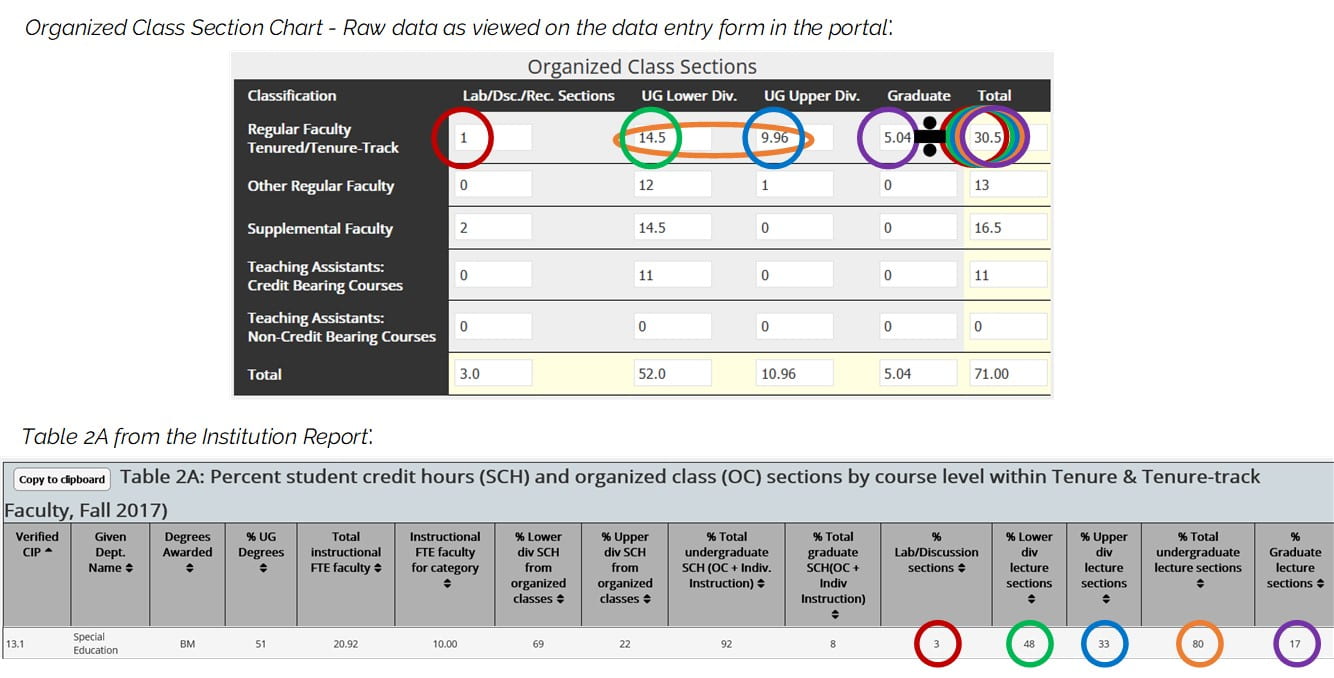
The measures shown on Table 2 are the result of row calculations on the raw data table, as shown in the example below:

The data here in Table 2A tells you that 69% of the SCH taught by Tenured/Tenure-Track faculty are at the lower division undergrad level and 22% are at the upper division undergrad level. When combined, this means that 92% of the SCH taught by Tenured/Tenure-Track faculty are at the undergrad level, and only 8% of the SCH taught by T/TT faculty are at the grad level.
Table 1 and Table 2 complement each other… For example, with this example program, Table 1 shows that T/TT faculty are teaching 100% of the grad SCH and only 37% of the undergrad SCH. However, this program is largely an undergrad program, because as Table 2 shows, 92% of the SCH that the T/TT faculty are teaching is at the undergrad level (and only 8% at the grad level).
Note that the same row calculations also occur with the Organized Class Sections raw data chart.

